MINTO APARTMENT REIT
Sustainability Report 2024
Table of Contents
- Welcome
> About this report
> About Minto Apartment REIT
> A message from our CEO - Governance
> Holding ourselves accountable
> Planning for today and tomorrow
> Nurturing our leaders of tomorrow
> Advancing a sustainability mindset
> Building better places to call home
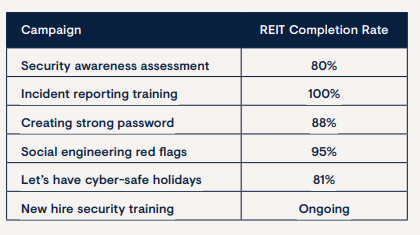
> Safeguarding against cyber threats
> Moving the sustainability higher
> Planning for the future - Community
> Creating a vibrant community for employees
> Building a foundation for growth
> Prioritizing employee health and safety
> Mentorship @ Minto: Strengthening employee connections and capabilities
> Connecting with residents and neighbours
> Giving back to the communities we serve - Environmental
> Striving to reduce environmental impact
> Continuing efforts to reduce water consumption
> Diverting waste from landfills
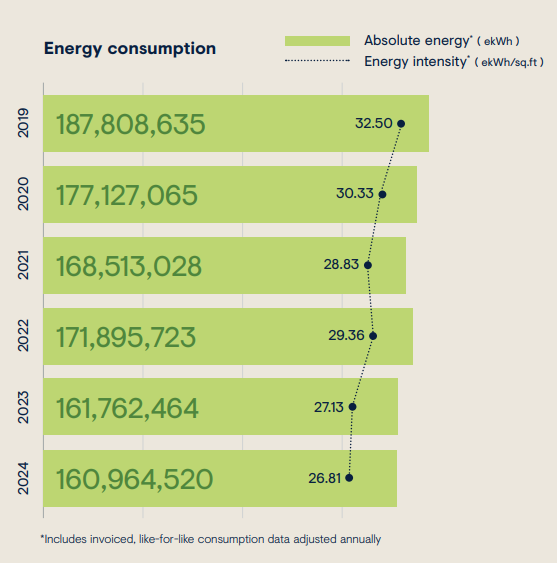
> Lowering energy consumption and carbon emissions
> Reducing GHG emissions at Minto Yorkville - Resources
> Materiality matrix
> ESG strategy, initiatives and targets
> Methodology
> GRI and SASB content indices
> Profiles of executive team and board of trustees
> Employees and our team
> Alignment with the United Nations sustainable development goals
About this report
- The ways we're building a more resilient business.
- How we’re making a positive impact in our communities.
- What steps we’re taking as part of our environmental responsibility
About Minto Apartment REIT
- Victoria
> CDL on one purpose-built rental project - Vancouver
> 1 property
> 113 suites - Calgary
> 4 properties
> 665 suites - Toronto
> 7 properties
> 2,484 suites
> Two properties under development - Ottawa
> 12 properties
> 2,543 suites
> CDL on one purpose-built rental project - Montréal
> 4 properties
> 1,793 suites
- Provide Unitholders with the opportunity to invest in high-quality income-producing multi-residential rental properties strategically located across urban centres in Canada’s major markets.
- Enhance asset value and maximize long-term Unitholder value through capital investments and active asset and property management of the portfolio.
- Provide Unitholders with predictable and sustainable cash distributions
- Expand the asset base across Canadian urban centres through acquisitions, intensification programs, and development
- 28 properties
- 7,598 suites
- $1,990 average monthly rent
- 96.8% average occupancy
A message from our CEO to our stakeholders
- Leading with integrity
- Strengthened cybersecurity and AI governance with the launch of a responsible AI policy.
- Empowering our people
- While engagement among REIT dedicated employees saw a slight dip, dual Minto Group/REIT employees met the 75th percentile benchmark.
- Building a greener future
- Reduced rental property energy use by 14% and carbon emissions by 16% since 2019.
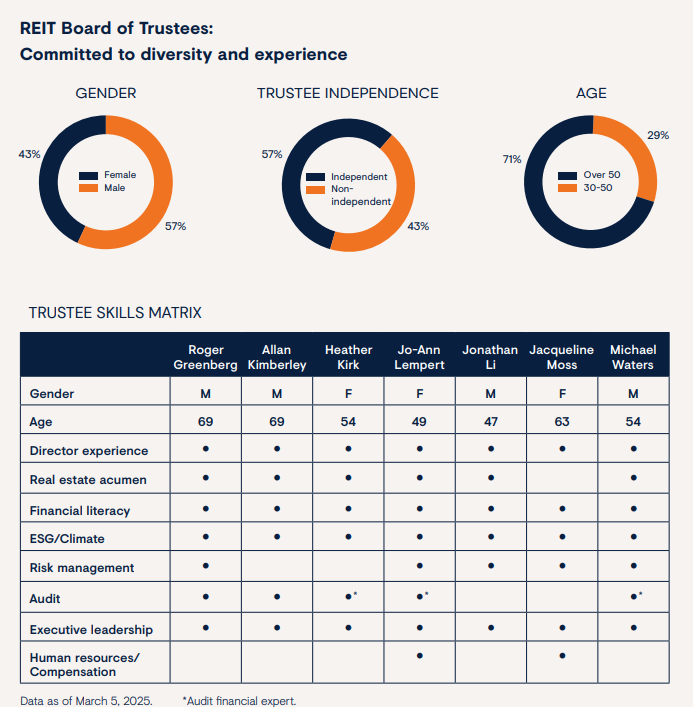
GOVERNANCE
Holding ourselves accountable
- An independent Lead Trustee, distinct from the Board Chair.
- Separation of the Board Chair and CEO roles.
- Committees composed entirely of independent trustees:
- Audit Committee
- Compensation, Governance, and Nominating Committee
- Approval of the overall strategic plan, business plan, and budget.
- Oversight of financial reporting and internal controls, risk management including climate-related risk, cybersecurity, artificial intelligence, succession planning, and sustainability.
- Setting CEO compensation and performance standards.
- Outlining processes for evaluating Board and Committee effectiveness.
- A continuing education program for members of the Board.
Planning for today – and tomorrow
- Updated and tested operational Business Continuity Plans for all functional areas of the REIT, covering critical activities with a maximum tolerable disruption period of two weeks.
- Established a governance structure for emergencies, including plan owners (operational), an Emergency Coordination Team (tactical), and a Crisis Management Team (strategic).
- Conducted tabletop and simulation exercises, including updates to governance, incident level matrix, triggers, and priorities.
Nurturing our leaders of tomorrow
Our leadership development strategy guides us in creating leaders at all levels, with a focus on women in leadership roles, to ensure we have a strong, committed, and resilient workforce now and in the years to come.
Advancing a sustainability mindset
- Customer experience.
- Employee experience.
- Health & safety.
- Environmental performance.
55% of our annual objectives are related to sustainability.
The REIT employs both dedicated sustainability staff and others with sustainability responsibilities.
Supporting excellence
- City of Toronto’s Deep Retrofit Challenge program.
- City of Toronto's Green Will Initiative.
- City of Toronto’s Tower Renewal Group.
- City of Toronto’s Building Emission Performance – High Rise Residential Advisory Group.
- REALPAC Zero Carbon and GHG Accounting working groups.
Building better places to call home
- 620 Martin Grove Rd and The Roe are LEED® Building Design and Construction Gold certified.
- Minto one80five is LEED® Building Operations and Maintenance Gold certified.
- 39 Niagara is LEED® Canada for New Construction 2009 Silver certified (certified on April 7, 2025).
Please visit our methodology for more information on the data included in this report.
- 4,595,790 square feet certified
- 62% of the portfolio certified under CRBP
- 4 buildings holding multiple certifications
- Multi-factor authentication
- Enhanced security features using Microsoft 365
- Regular employee training to spot and avoid phishing, spoofing, and other scams
- Committed to safeguarding the personal information of our customers, website visitors, and more
- Compliant with Canadian and U.S. privacy legislation
- Adherence to the 10 principles outlined in the Canadian Standards Association’s Model Code for the Protection of Personal Information (CAN/CSA-Q830-96) AI technologies and policies
- Follow ethical guidelines and governance frameworks
- Developed and deployed in a manner that aligns with our core values and societal responsibilities
All REIT employees have completed at least one of the 2024 training campaigns listed below:
- Canada Green Building Council
- ENERQUALITY
- GRESB
- National Research Council Canada
- La Corporation des propriétaires immobiliers du Québec
- Calgary Residential Rental Association
- The Quarry Park Land Owners’ Association
- Eastern Ontario Landlord Organization
- Federation of Rental-Housing Providers of Ontario
- Greater Toronto Apartment Association
- REALPAC
- Urban Land Institute
- Canadian Home Builders’ Association
- Infrastructure Health and Safety Association
- WorldatWork Total Rewards Association
COMMUNITY
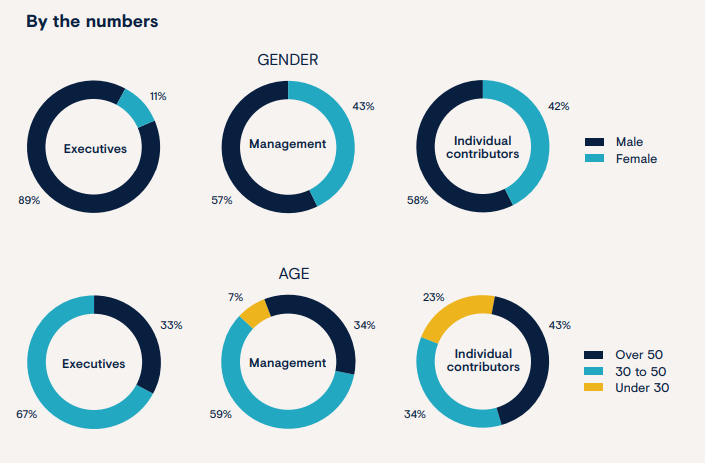
- 41% of employees are female
- 66% of the management team are 50 or under
- 29% new roles tied to growth plans
| Male | Female | Total | Alberta | Ontario | Quebec | Total | |
|---|---|---|---|---|---|---|---|
| Full-time | 131 | 85 | 216 | 10 | 158 | 48 | 216 |
| Part-time | 18 | 18 | 36 | 0 | 35 | 1 | 36 |
| Total | 149 | 103 | 252 | 10 | 193 | 49 | 252 |
- 84% participation rate
- 72 surveys completed
- 75th percentile – the top quartile of surveyed employers
Advancing our commitment to continuous learning and leadership
- New virtual instructor led courses to enhance leadership skills. Every course integrates the importance of collaboration and the appreciation of different learning styles and perceptions, with the focus on effectiveness, productivity, and intentional actions.
- Customized 360° leadership assessments to measure the competencies critical to leading and better identify potential candidates.
- 79% REIT employee participation rate
- 108 REI surveys completed
- 51st percentile reached - higher than half the participating businesses
Investing in employee health and well-being
- New mental health resources were added to our intranet in 2024. When faced with uncomfortable topics and challenges, employees can find comfort and tools to help them navigate.
- Our Maternity/Parental Leave Top-up Program in Canada enhances employee work-life balance, encourages gender equality, boosts morale, and attracts and retains top talent.
Recognizing employees that go above and beyond
 MEET OUR 2024 GREENBERG AWARD WINNERS
- Developing a Health and Safety Code of Conduct to be posted at all work sites and included in health and safety related contracts and training materials.
- Translating Health and Safety orientation videos into 14 different languages to ensure all workers clearly understand our Health and Safety policies and procedures.
- Updating the Health and Safety objectives in our annual performance targets to focus not only on achieving key metrics but also on demonstrating behaviours that support a culture of Health and Safety.
Safety and improvement strategies
- A robust safety culture: encouraging worker engagement and participation in safety awareness training at all organizational levels
- Regular hazard assessments: performing hazard assessments before starting any job to prevent incidents
- Employee training: investing in annual refresher and job-specific training onsite or through eLearning to keep safety top of mind.
CASE STUDY - SUCCESSFUL MENTOR-MENTEE
Mentorship @ Minto: Strengthening employee connections and capabilities
94% of mentees surveyed said it has positively affected their engagement at work.
Connecting with residents and neighbours
We know a home is more than just the structure in which someone lives. It extends to the people around them, and the connections and sense of belonging they build together.
Here’s a small sample:
- Community Shred It Day to dispose of documents, hard drives and other old technology safely.
- Doggy Swim and Pet of the Month award to include our furry friends.
- Super Bowl watch parties to cheer together.
- Pie Day, Taco Tuesday, Wine and Cheese Nights, Coffee and Donut events, food trucks and more.
- Toy and food drives to assist others in our communities.
Pledge matching and donations
ENVIRONMENTAL
Striving to reduce our environmental impact
- York Mills & Leslie – new terrace homes and amenity space with stand-alone mechanical systems for each unit for improved energy efficiency and enhanced resident comfort.
- Richgrove Village – a new tower with Energy Star appliances, low flow toilets, faucets and showerheads, and EV chargers in the parking garage. Mechanical systems use outdoor air (instead of a chiller) in the winter to provide cooling and reduce energy consumption.
- Waste diversion – projects achieved an average construction waste diversion rate of 86.4% in 2024. This is down slightly from 88.3% in 2023 but still higher than our 80% target.
- 3,962,000 invested in environmental improvements in 2024
- The REIT set targets to use 10% less energy and 5% less water at our properties by 2025 compared to our 2019 baseline and has already outperformed the energy target.
- Installation of toilet sensors at more properties to reduce water wasted from leaking or running toilets.
- Resident engagement and education on how to reduce consumption, identify and report leaks and more
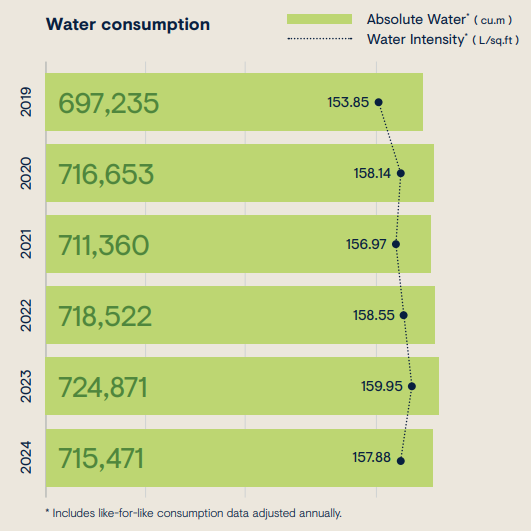
1.3% reduction in water consumption since 2023.
Diverting waste from landfills
Our goal is to reduce waste and increase diversion through on-site source separation programs and partnerships.
Lowering energy consumption and carbon emissions
- Building Automation Systems that leverage artificial intelligence to optimize equipment efficiency.
- Duct sealing to eliminate air leaks and improve airflow efficiency.
- Garage lighting controls that dim lights over unoccupied parking stalls while maintaining safety lighting levels in drive aisles.
- Collecting building data, including age, window condition, and mechanical systems
- Determining optimal timing for transitioning mechanical systems to low-carbon fuels.
- Calculating total portfolio expenditures and greenhouse gas (GHG) intensity.
- Analyzing yearly expenditures to avoid spending spikes and adjust project timelines accordingly.
- Evaluating GHG intensity reductions resulting from planned upgrades.
- Iterating these steps to optimize spending while meeting regulatory and voluntary targets.
- Developing a decarbonization strategy for new construction and identify priority systems for upgrades**.
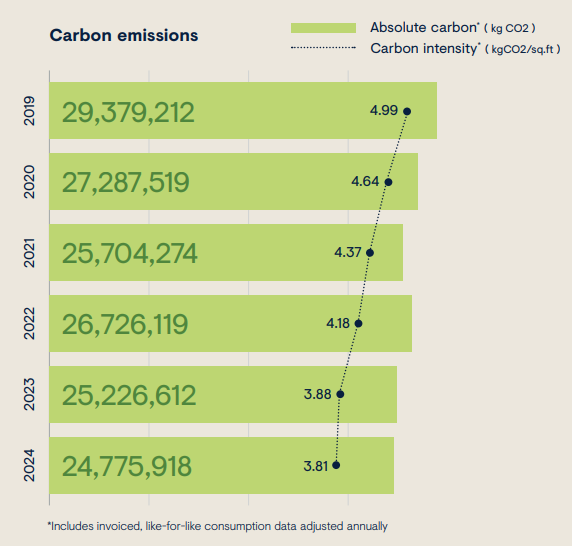
16% reduction in carbon emissions since 2019.
Reducing GHG emissions at Minto Yorkville
- Execution of a “duct seal” project to reduce air leakage from the main ventilation. We were able to achieve a 20% reduction in air leakage, driving energy savings while delivering heating and cooling to the corridors.
- Installation of a new higher efficiency domestic water booster pump with integrated controls.
- Removal of the old chiller, cooling tower and ancillary equipment.
- Installation of new air source heat pumps (ASHP) and heat recovery chiller including piping connections from new equipment to existing systems.
Minto Yorkville key retrofit metrics:
- 20% reduction of ventilation ductwork air leakage
- 50% energy reduction target
- 80% GHG emissions reduction target
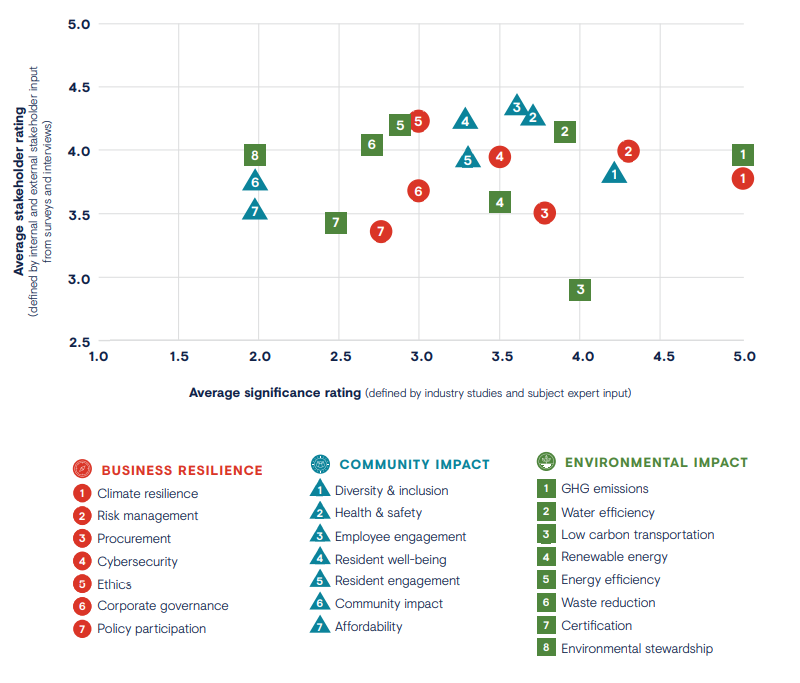
Materiality matrix
Listening to our stakeholders
ESG materiality matrix
ESG strategy, initiatives, and targets
Building a resilient business
| Initiative | Targets |
|---|---|
Climate change resilience - assess risks
Establish climate change risk assessment process for stabilized properties, assess risks,and identify recommended mitigation measures. Add assessment of climate change risks to due diligence process for new acquisitions. | 2021: - Define scope and approach for assessing climate change risks at properties and new acquisitions 2022: - Incorporate assessment of climate change risk into due diligence process for new acquisitions. - Establish a target for completing stabilized properties assessment. |
Climate change resilience – design for extreme weather | |
Plan for resilience to extreme weather events for all new developments. | 2021: - Define resilience features to include in new developments (adapted to region and product). 2022: - Incorporate resilience features into the design of new developments. |
Risk management – update emergency response and business continuity plans | |
Update corporate and property emergency response and business continuity plans (BCPs) with broader set of catastrophic and disruptive events. | 2021: - Complete inventory of current emergency response plans and BCPs. 2022: - Identify emergency response plan and BCP gaps. - Update the corporate pandemic plan with lessons learned and geographical differences. - Update site pandemic plans and catastrophic disruption plans and add links to corporate plans. 2023: - Finalize emergency response and business continuity plans. |
Responsible procurement – expand ESG requirements in procurement process | |
Define ESG requirements in supplier and consultant bids, evaluations, and assessments. | 2022: - Define ESG requirements in bids, evaluations, and assessments and share with major suppliers and consultants. 2025: - Define ESG requirements in bids, evaluations, and assessments and share with non-major suppliers and consultants. - Verify compliance of major suppliers and consultants with ESG requirements. |
ESG innovation – implement program | |
Implement a program to support value-added ESG innovation into culture, process, and product. | 2022: - Implement innovation program. - Implement ESG innovation pilot projects (ongoing commitment). > New developments: 2 pilot projects per development. > Operations: 2 per year. 2023: - Initiate an Innovation Working Group. |
Cybersecurity – strengthen program | |
Strengthen processes, procedures, and controls to detect and mitigate cybersecurity risks and prevent data leakage. | 2022: - Define incident response management plan. - Enhance and mature cyber monitoring solutions by integrating application and operational data with threat intelligence. - Strengthen the cybersecurity governance to include the operational technology devices. - Review and refresh vendor risk management processes and policies. - Review and refresh data management policies and procedures. 2025: - Deploy multi-factor authentication across all systems in the organization. - Implement formal secure software development life cycle process and penetration testing for all in-house development. - Implement data loss prevention policies and processes. |
Making a positive community impact
| Initiative | Targets |
|---|---|
Employee engagement – expand ESG training and communication, seek relevant competencies in recruitment | |
Expand on ESG competencies through employee onboarding, professional development, recruitment, and on-going communication programs. INCLUDES: - Introduction to ESG course for new and existing employees. - Identify existing courses that are ESG-related. - Evaluate need for additional ESG training required to support strategy - additions to existing courses, new courses, on-the-job training, and role-specific training. - Map competencies, prepare resources to support evaluation of recruitment candidates for identified competencies and to confirm they are supportive of goals, train hiring managers. - Develop communication plan. | 2021: - Roll-out introduction to ESG training. - Identify needs for more in-depth training. - Code courses that are ESG-related. - Implement communication plan. 2022: - Train hiring managers to seek candidates with compatible ESG experience, qualifications, and approach. |
Diversity and inclusion – address inequities, promote diversity and inclusion | |
Implement program to address systemic inequities and promote diversity & inclusion (D&I). INITIAL PROGRAM ELEMENTS: - Build a foundation for promoting D&I: ◦ Implement third party survey of employees to identify gaps and gather input on how to build an inclusive culture and eliminate systemic barriers. ◦ Involve employees in updating the workplace diversity policy. - Reduce barriers to D&I in recruitment: ◦ Review and update job descriptions. ◦ Expand recruitment channels, broaden networks and establish partnerships to reach a more diverse pool of candidates. ◦ Apply pre-screening and structured interviews to minimize inherent bias. - Expand mandatory training on D&I. - Help members develop a sense of equity and belonging within their workplace and foster a diverse, inclusive workplace through the creation of Employee Resource Groups (ERGs). - Add D&I measure to annual performance and incentive plans. | 2021: |
Diversity and inclusion – collect data | |
| Explore best practices for diversity data collection and disclosure. | 2023: |
Resident wellbeing – establish core features and procedures | |
Establish health & wellbeing framework for all new developments and stabilized properties. | 2023: |
Resident engagement – implement program to build connections, drive change, and cultivate partnerships | |
Develop a resident engagement program to build connections, drive change, and cultivate partnerships including fostering sustainable behaviours. | 2022: |
Community impact – define focus and future approach for community engagement, giving, and volunteering | |
Examine current approach to community engagement, giving, and volunteering and develop recommendation on future focus and approach STEPS INCLUDE: | 2023: |
Championing environmental responsibility
| Initiative | Targets |
|---|---|
| Energy and water efficiency – reduce usage | |
Reduce portfolio energy use by 10% and water use by 5% by 2025, from 2019 baseline. | - Reduce energy use by approximately 2% and water use by 1% each year (ongoing commitment). |
| Energy efficiency – set targets for new development | |
Set energy efficiency and emissions targets for new developments (adapted to region). | 2021: |
| Energy and water efficiency - increase real-time monitoring | |
Integrate technology into new and existing buildings to identify opportunities for improved performance and comfort. | 2022: |
Greenhouse gas emissions – reduce embodied carbon | |
Measure embodied carbon in new developments to drive low-carbon development decisions. | 2021: |
Renewable energy – implement a strategy | |
Deploy renewable energy strategy for new developments and stabilized properties. | 2021: |
Waste reduction and diversion – increase diversion through partnerships | |
Develop and leverage regional waste reduction and diversion partnerships for new developments and stabilized properties. | 2021: |
Methodology
Building Certifications
The percentage of the portfolio certified under a green building (environmental) standard was calculated using the total gross floor area of all buildings with at least one certification as the numerator and the total gross floor area of the portfolio at the end of the reporting year as the denominator.
Number of Employees
The total number of employees reported and used to calculate the percentage of employees in the reported categories is the number of active employees solely employed by the REIT and dual employees who worked for both the REIT and Minto Group at the end of the calendar year. The total includes permanent and temporary employees, full-time and part-time employees, and unionized and non-unionized employees. The count is based on the employee count rather than full-time equivalents.
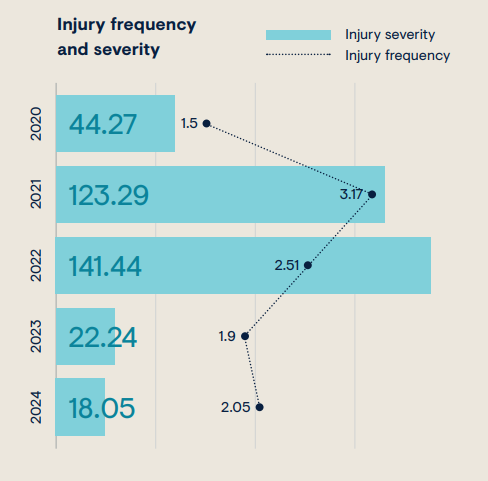
Health & Safety Performance
Injury data was obtained from occupational illness and injury reports for Minto Apartment REIT employees.
Frequency rates are calculated based on the number of lost time claims (worker misses work due to workplace injury or illness —excluding the day of the injury) multiplied by 200,000 hours divided by derived hours worked.
Severity rates are calculated based on the total number of lost days multiplied by 200,000 hours divided by derived hours worked where lost days are the number of days missed at work due to a workplace injury or illness —excluding the day of the injury.
Our Investment Properties – Utility and Carbon Performance
Utility and carbon performance are measured in energy consumption (electricity and natural gas), carbon emissions (location-based carbon dioxide equivalents calculated from natural gas and electricity consumption using Canadian provincial emission factors from the National Inventory Document submitted by Canada to the United Nations Framework Convention on Climate Change), and water consumption (includes domestic water usage, pools, irrigation, and renovation work).
All building performance data was recorded from buildings using the “operational control” approach. With this approach, the REIT reports the building consumption and emissions for which it has an ownership stake, daily operational control, and the power to implement operational policies.
Data has not been normalized for weather or other metrics.
The carbon footprint reported does not include indirect emissions caused as a result of our business activities.
Like-for–Like Consumption, Emissions, and Intensities
To enable monitoring of changes in building performance, like-for-like data is reported in the body of the report and in the like-for-like percentage change in energy and water consumption reported in the GRI and SASB Content Indices. “Like-for-like” includes comparable data points from consecutive reporting years where data availability covers the full year, data coverage is the same, and assets are standing investments. Acquisitions are included once a full calendar year of data is available. Newly constructed buildings are included after one year of stabilized occupancy. Dispositions are removed from all years once sold. Previous years are adjusted to reflect changes in the portfolio and data coverage as well as adjustments to published emission factors to allow comparison of a like set of properties. Where full data from previous years is not available, previous consumption will be estimated based on available data.
All invoiced consumption for the like-for-like portfolio is included in the absolute consumption and emission totals.
Only buildings for which the REIT has whole building water consumption data were included in the water intensity calculation, accounting for 71% of portfolio leasable floor area in 2024. Water intensity is measured in litres of water consumed per square foot of gross leasable area.
Only buildings for which the REIT has whole building consumption data for both electricity and natural gas are included in the energy and carbon intensity calculations, accounting for 52% of portfolio leasable floor area in 2024. Energy intensity is measured in equivalent kilowatt hours of electricity and natural gas consumed per square foot of gross leasable area. Carbon intensity is measured in kilograms of carbon dioxide equivalents emitted per square foot of gross leasable area.
Energy and water targets are measured against a 2019 baseline. Baseline and subsequent years’ data is adjusted to reflect changes to the portfolio and data coverage as well as adjustments to published emission factors to ensure comparable (like-for-like) data points are reported year to year.
Absolute Consumption and Emissions
All other consumption and emission figures (see GRI and SASB indices) include all buildings in the portfolio and all data gathered and calculated from utility invoices as well as data obtained from other sources such as through Ontario’s Energy and Water Reporting and Benchmarking program. Data coverage for these figures is not consistent year over year. Buildings are included in these figures if they are part of the portfolio for only part of the year and if full building data is not available (where residents are directly billed by the utility and the data is not available to the REIT for that consumption). In 2024, absolute natural gas consumption and scope 1 emissions data were available for 93% of the portfolio’s gross floor area, absolute electricity consumption and scope 2 emissions data were available for 68% of the portfolio’s gross floor area, and absolute water consumption data was available for 72% of the portfolio’s gross floor area. Electricity data coverage was higher in 2022 due to access to full building electricity consumption data for buildings in the City of Montreal in 2022 while 2023 and 2024 data for Montreal tenants directly billed by the utility was not available.
Our Rental Building and Construction Project Performance: Solid Waste
Our Investment Properties
Waste data was collected by our waste management partner. The data, reporting the volume of waste sent to landfill and the volume of waste diverted from landfill, was available from properties representing 42% of the portfolio’s gross floor area during the 2024 reporting year.
Our New Development Projects
Construction waste diversion is measured by comparing the total amount of waste generated with the total amount of waste diverted from landfill through recycling or reuse, as reported by our waste haulers.
Leasable Area Located in 100-Year Flood Zones
Properties in 100-year flood zones were identified by the REIT’s property insurer and confirmed through local flood maps, hydraulic modeling, and a study conducted by Golder Associates.
Identification of Regions with High or Extremely High Baseline Water Stress
Regions with high or extremely high baseline water stress were identified using the World Resources Institute Aqueduct Water Risk Atlas.
GRI and SASB Content Indices
GRI content index
| Statement of use | Minto Apartment REIT has reported in accordance with the GRI Standards for the periodJanuary 1, 2024 to December 31, 2024. |
| GRI 1 used | GRI 1: Foundation 2021. |
| Applicable GRI sector standard(s) | None. |
GRI standards used | GRI 1: Foundation 2021. |
Other sources of reported standards | Sustainability Accounting Standards Board Real Estate Sustainability Accounting Standard, Industry Standard, Version 2018-10. |
| GRI standard/other source | Disclosure | Location |
|---|---|---|
| GRI 2: General disclosures 2021 | 2-1 Organizational details | A. Legal name: Minto Apartment Real Estate Investment Trust (the REIT). |
2-2 Entities included in the organization’s sustainability reporting | A. Entities included in its sustainability reporting: The Sustainability Report and reported financial statements are applicable to Minto Apartment REIT and Minto Apartment Limited Partnership, which is consolidated by the REIT. B. Differences between entities included in audited Consolidated Financial Statements and its sustainability reporting: None. See Consolidated Financial Statements page 5 Description of the entity. C. Consolidation of information: Consolidated Financial Statements page 5 Basis of consolidation. | |
2-3 Reporting period, frequency and contact point | A. Sustainability Report reporting period and the frequency: The reporting period for the Sustainability Report is the calendar year starting January 1, 2024 and ending December 31, 2024 except where otherwise stated. Previous year’s data has been included for comparison. The frequency is annual. B. Financial reporting period: The calendar year starting January 1, 2024 and ending December 31, 2024. C. Sustainability Report publication date: September 8, 2025. D. Contact point for questions: [email protected]. | |
2-4 Restatements of information | A. Restatements of information: Emission factors used to calculate greenhouse gas emissions were updated in line with the most recently published National Inventory Document (Canada’s submission to the United Nations Framework Convention on Climate Change). Some previously reported consumption values were also updated to reflect latest invoiced consumption. The changes were made to align with the latest available information. Metrics are also updated to reflect changes to the portfolio as described in the Methodology on page 2. The changes are not material. | |
2-5 External assurance | External assurance: The report has not been externally assured. | |
2-6 Activities, value chain and other business relationships | A. Sectors: Real estate. B. Value chain: As of December 31, 2024, the REIT owns and operates a portfolio of 28 Canadian, multi-residential rental properties in Toronto, Ottawa, Montreal, and Calgary. See Annual Report page 15 for additional information including Key Performance Indicators. The REIT serves its unitholders and tenants while also supporting its employees, partners, and communities. The supply chain includes services providers, suppliers of materials, contractors, and trades to support asset management, property operations, renovations, and infill development projects. C. Relevant business relationships: Certain advisory, transaction, and support services, including clerical and administrative support, operational support for the administration of the day-to-day activities of the REIT and office space are provided by the Minto Group through an administrative support agreement. D. Significant changes: No significant changes. | |
2-7 Employees | For 2024 worker information see the 2024 Sustainability Report page 17 and 18 and Who Makes Up Our Team on pages 1 to 2. See 2023 ESG Report pages 19 and Who Makes Up Our Team pages 1 to 3 for 2023 worker information. Data reported is compiled from Minto’s Human Resources Information System and includes employees solely employed by the REIT and dual employees who work for both the REIT and Minto Group. Numbers are reported in head count at the end of the reporting period. See the Methodology page 1 for additional details. There are no significant variations in numbers reported. | |
2-8 Workers who are not employees | Omission - Information unavailable / incomplete. The REIT does not track the number or breakdown of employees who do not work for the REIT but work for organizations which have contractual relationships to support the REIT and its activities. Where contractors are used, the REIT may provide direction regarding the work performed, but the REIT does not control the selection of non-REIT employees for or assignment of non-REIT employees to the work. The employees and the number of employees are controlled by their organization. The REIT is not currently taking steps to collect this information. The Minto Group provides advisory, transaction, and support services to the REIT through an administrative support agreement. Minto Group discloses information on its employees in its annual Sustainability Report. See Minto Group Sustainability Report page 20 and Who Makes Up the Minto Group Team pages 1 to 2. Note: Not all of the employees listed in the Minto Group report support the REIT. | |
2-9 Governance structure and composition | A. Governance structure: See Annual Information Form page 40 to 53. B. Committees of the Board of Trustees: See Annual Information Form page 51 to 53. C. Trustees, Committee membership, independence: See Management Information Circular page 21, 22 Trustee age and gender, number ethnically diverse (additional indicators of diversity/ under-represented social groups are not reported), experience/competencies/stakeholder representation: See Management Information Circular page 28-29, 26-27, 8-14, Executive, non-executive: See Management Information Circular page 18. Significant positions and tenure: See Management Information Circular page 8 to 14 | |
2-10 Nomination and selection of the highest governance body | Nomination, election, appointment: See Management Information Circular page 17 to 18. See Amended and Restated Declaration of Trust pages 12, 14-15. Qualification, residency, independence: See Management Information Circular page 28-29. | |
2-11 Chair of the highest governance body | A. See Management Information Circular page 8, 18-19. B. See Management Information Circular page 8, 18-19, 22 to 24. | |
2-12 Role of the highest governance body in overseeing the management of impacts | A. See Annual Information Form pages 40, 45 to 46, see this 2024 Sustainability Report page 7. B. Due diligence: Senior management is responsible for overseeing due diligence. See Annual Information Form page 45 (senior management), 32 (environmental risk). The REIT maintains multiple processes for evaluating and managing risk. Examples include: - Broad processes such as maintenance of an Enterprise Risk Assessment which is reviewed and updated on an annual basis and includes consideration of likelihood of the risk, impact, and controls. - Transactional processes such as our due diligence process for new acquisitions which includes evaluation of ESG-related risks. - Subject matter-specific processes such as cyber security risk assessments, inspections to identify health and safety hazards or building-specific risks and anomalies, and our climate change risk assessment initiative. Management has multiple mechanisms for stakeholder engagement including: - A formal ESG Materiality Assessment. - On-going tenant engagement surveys (includes activity prompted surveys for arrival, departure, and service). - Annual employee engagement surveys. The ESG strategy was established to respond to material ESG topics. The Board of Trustees approved the strategy and receives quarterly updates on implementation. C. Annual Information Form page 40, Amended Charter of the Board of Trustees pages 2 and 6. | |
2-13 Delegation of responsibility for managing impacts | A. The Board has set out CEO responsibilities which include responsibility for plans, strategies, budgets, internal controls and risk management and include overseeing the development and implementation of the strategic plan and ESG strategy. See Annual Information Form page 45-47 for additional detail. B. Senior executives and other employees report to the Board quarterly during meetings of the Board of Trustees. | |
2-14 Role of the highest governance body in sustainability reporting | The Sustainability Report is circulated to and reviewed by the Board of Trustees and CEO. See Charter of the Board of Trustees page 6. | |
2-15 Conflicts of interest | Annual Information Form page 33, 41-42. Annual Report page 46. Charter of the Board of Trustees page 3-4, 6. Disclosures will be made when deemed material as described in the Disclosure and Confidential Information Policy page 4-5. | |
2-16 Communication of critical concerns | A. See Charter of the Board of Trustees page 5 (Expectation of and Access to Management). B. No applicable critical concerns noted. | |
2-17 Collective knowledge of the highest governance body | See Management Information Circular page 29. | |
2-18 Evaluation of the performance of the highest governance body | A. See Charter of the Board of Trustees page 7. B. Frequency and independence to be determined by the Board per above. C. No actions reported; Management Information Circular page 28. | |
2-19 Remuneration policies | See Management Information Circular page 33 to 61. See Compensation Clawback Policy page 1 to 2. | |
2-20 Process to determine remuneration | See Management Information Circular page 33 to 61. | |
2-21 Annual total compensation ratio | A. Ratio of the annual total compensation for the organization’s highest-paid individual to the median annual total compensation for all employees (excluding the highest-paid individual) for 2024: 27:1. B. Ratio of the percentage increase in annual total compensation for the organization’s highest-paid individual to the median percentage increase in annual total compensation for all employees (excluding the highest-paid individual) 2023 to 2024: 3:1. C. Contextual information: - Title of highest paid individual: President and Chief Operating Officer. - Exclusions: ◦ Employees on any type of leave, Temporary or casual employees. - FTE equivalent used for pay rates. - Comp included: ◦ Base salary. ◦ Target STIP (bonus). ◦ Car allowance. ◦ Employee referral bonus. ◦ Special bonus (e.g. misc.). ◦ Commissions. ◦ Housing allowance. ◦ ER pension contributions. ◦ REIT Deferred Share Unit grants issued in-year. › REIT DSU redistributions issued in-year. - Re: A. Median total compensation increased due to planned year over year salary increase and actual bonus pay out above target. - Re: B. Highest paid increase is due to the increase in payout bonus and Deferred Units & Performance Units redistributions. For 2023 ratio see 2023 ESG Report page 58 to 59. | |
2-22 Statement on sustainable development strategy | See this 2024 Sustainability Report page 5. See Annual Report fourth page of document (not numbered), page 10. See ESG Strategy Initiatives and Targets page 1 to 8 approved by senior management and the Board of Trustees | |
2-23 Policy commitments | The REIT is committed to sound corporate governance practices as described in the policies and charters available on our Corporate Governance webpage including our Code of Business Conduct and Ethics. Descriptions and stipulated commitments and applicable references are included in the documents: The REIT ESG commitments are on the website. The REIT also follows Minto Group policies including the Environmental Policy and Health and Safety Policy. Particular attention has not been given to specific categories of people or vulnerable groups. Commitments apply to all activities and relationships equally. Policy approval: See Management Information Circular page 48 (t) re: formulation and oversight of REIT policies and processes. See Charter of the Board of Trustees page 6 and Management Information Circular page 26 re: Board responsibility for reviewing the REIT’s policies and practices. Minto Group Environmental and Health and Safety policies approved by the Minto Group CEO. Policies are available to employees on the intranet site and to all stakeholders on the website. Introduction to policies is part of the on-boarding process. The Code of Business Conduct and Ethics, Disclosure and Confidential Information Policy, and Insider Trading Policy include an employee acknowledgement (date and signature). Precautionary principle: The REIT faces a variety of diverse risks, many of which are inherent in the business conducted by the REIT. The REIT maintains multiple processes for evaluating and managing risk. Examples include: - Broad processes such as maintenance of an Enterprise Risk Assessment which is reviewed and updated on an annual basis and includes consideration of likelihood of the risk, impact, and controls. - Transactional processes such as our due diligence process for new acquisitions which includes evaluation of ESG-related risks. - Subject matter-specific processes such as cyber security risk assessments, inspections to identify health and safety hazards or building-specific risks and anomalies, and our climate change risk assessment initiative. Measures for mitigating risks include policy commitments. Where a risk has not been identified as applicable to the REIT or its workers, that risk may not be specifically covered. The effectiveness of risk mitigation measures is evaluated in subsequent assessments. | |
2-24 Embedding policy commitments | Responsibility, integration, implementation: Management Information Circular page 47 and 48. Business relationship commitments (rights and obligations): Management Information Circular page 62-67. Training on policies is provided as part of on-boarding and as needed for refreshers or changes. | |
2-25 Processes to remediate negative impacts | Remediation of impacts commitments and processes: ESG Strategy Initiatives and Targets page 1 to 8. Feedback, grievance approach, mechanisms, stakeholder involvement: Workplace Harassment & Discrimination Policy Page 5 to 7. Risk identification and management: Management Information Circular page 48, Management’s Discussion and Analysis page 42 to 49. Stakeholder input: Feedback and identification of opportunities. | |
2-26 Mechanisms for seeking advice and raising concerns | ||
2-27 Compliance with laws and regulations | No material instances of non-compliance identified through internal or external audits. | |
2-28 Membership associations | The 2024 Sustainability Report page 14. | |
2-29 Approach to stakeholder engagement | Stakeholders, as determined by the REIT with external consultant input, engaged in the ESG Materiality Assessment: employees including members of the executive leadership team, tenants, procurement partners, members of the Board of Trustees, analysts, investors, and municipal representatives. Tenant engagement surveys are conducted on an on-going basis. Employee engagement surveys are conducted annually. Quarterly presentations are delivered to the Board and shareholders | |
2-30 Collective bargaining agreements | Percentage of total employees covered by collective bargaining agreements: Who Makes Up Our Team page 1. Working conditions and terms of employment for other employees are not based on collective bargaining agreements | |
GRI 3: Material Topics 2021 | 3-1 Process to determine material topics | Material ESG topics were determined through the ESG Materiality Assessment. Topics and impacts were identified with external consultant support and input from employees, external stakeholders and subject experts. Additional detail is provided here. Topics with a stakeholder or significance rating greater than 4.0 out of 5 are deemed material. |
3-2 List of material topics | The list of material topics is unchanged: 1. Energy efficiency. 2. Greenhouse gas emissions. 3. Climate change resilience. 4. Waste reduction and diversion. 5. Water efficiency. 6. Resident well-being. 7. Health and safety. 8. Employee engagement and well-being. 9. Diversity and inclusion. 10. Ethical business conduct and whistleblower program. 11. Risk management. | |
3-3 Management of material topics | Material topics were defined through the ESG Materiality Assessment. Actual positive and/or negative impacts from these topics occur in the management and operation of the REIT and its assets and include impacts the organization caused or contributed to and impacts linked to the REIT such as utilities consumed by tenants. Topics and impacts are limited to those for which the REIT has control and influence. The approach to and purpose for managing ESG topics and specific actions are described in our ESG commitments in the 2022 ESG Report page 9, in the ESG Strategy Initiatives and Targets, and within the topic-specific disclosures in this document. Policies are described in 2-23 of this matrix. Key commitments, goals, and targets are in the ESG strategy. See ESG Strategy Initiatives and Targets. Oversight of ESG topics is provided by the senior leadership team and the Board of Trustees. Progress is tracked and reported quarterly including lessons learned. Resources required to manage ESG topics and achieve targets are made available through the annual budget process. The identification of material topics was informed by priorities identified by stakeholders. The management approach for all ESG topics was evaluated through the Gap Analysis conducted by an external expert. Gap Analysis results, including a maturity analysis and recommendations, were reported to the ESG Steering Committee, the leadership team, and the Board and led to the development of the ESG strategy. Adjustments to the management approach are documented in the ESG strategy initiatives and targets. |
Disclosure number title | Explanation or where to find |
|---|---|
205 Anti-corruption 205-3 | No incidents. The REIT maintains a whistleblower policy available here. The Code of Business Code and Ethics is available here. The Insider Trading Policy is available here. (Material topic: Ethical business conduct and whistleblower program). |
302 Energy 302-3 | Energy intensity ratio: the 2024 Sustainability Report page 30 includes like-for-like consumption data and intensity ratio. Information on this metric is described in the 2024 Sustainability Report page 30 and in the report Methodology on pages 1 and 2. The energy intensity ratio uses energy consumption within the portfolio and includes natural gas and electricity. Additional energy disclosures are later in this document in the SASB Content Index metrics IF-RE-130s.1 to 5. The 2024 Sustainability Report includes information on energy management on pages 26-27, 30, 32. Projects implemented to reduce portfolio energy consumption include Building Automation System (BAS) and BAS AI installation, Endotherm, DuctSeal, LED lighting, lighting controls and motion sensor retrofits, installation of higher efficiency equipment including variable frequency drives, boiler and fan coil unit replacements, Evolve showerheads and Energy Star appliances, and tenant engagement. Environmental Policy: here. (Material topic: Energy efficiency). |
303 Water and Effluents 303-5 | Water interactions and impacts include consumption from local drinking water supply systems and discharges to local wastewater systems from the operation of rental properties, construction and renovation projects, and REIT offices. The REIT does not take water directly from the environment. Water is included in technical building assessments which are completed for approximately one-third of our portfolio each year, identifying risks as well as opportunities to reduce risks and impacts. Strategies and practices to mitigate risks include monitoring consumption to identify anomalies and see the impact of implemented measures, implementation of capital projects to increase water efficiency (implemented projects include high efficiency fixtures such as faucets and toilets, Evolve showerheads, Energy Star appliances, irrigation controls, leak detection systems, water shut-off valves, and toilet renewals), staff training to increase awareness and optimize operational efficiency, and resident engagement to encourage reduction in usage. Targets were set as part of the ESG strategy development process and are consistent across the portfolio. The water target is on page 6 of the ESG Standards for wastewater discharges are set by the local governing bodies including the provincial and municipal governments. 2023 portfolio water consumption in megalitres: 809. 2024 portfolio water consumption in megalitres: 724. 2023 water consumption from all areas with high water stress (Calgary, Edmonton, Toronto) in megalitres: 428. 2024 water consumption from all areas with high water stress (Calgary, Toronto) in megalitres: 396. Water discharges to storm and sanitary sewers are not metered. Water storage is not a significant water-related impact. Consumption data is from water meters and is provided by the water utilities. See also the 2024 Sustainability Report pages 27 and 28 and the Methodology on pages 1 to 3. Water disclosures are also provided in the SASB Content Index later in this document in metrics IF-RE-140a.1 to 4. Environmental Policy: here. (Material topic: Water efficiency). |
| 305 Emissions 305-1 | 2023 Gross Scope 1 GHG emissions in metric tonnes of CO2 equivalent: 23,140. 2024 Gross Scope 1 GHG emissions in metric tonnes of CO2 equivalent: 21,856. 2023 Gross Scope 2 GHG emissions in metric tonnes of CO2 equivalent: 3504. 2024 Gross Scope 2 GHG emissions in metric tonnes of CO2 equivalent: 3107. - Gases included in scope 1 GHG emissions are from natural gas consumption, operational control approach, and do not include biogenic emissions. - Scope 2 GHG emissions are from electricity consumption, location-based operational control approach. - There is no base year for the calculation. - Emission factors are from Canada's National Inventory Report submissions to the United Nations Framework Convention on Climate Change (previous year calculations updated with latest emission factors). - See the 2024 Sustainability Report pages 26-27, and 30-32 for additional carbon-related reporting and the Methodology on pages 1 to 3. No offsets were used. Environmental Policy: here. The REIT has committed to reaching net-zero carbon emissions by 2050 for the portfolio. (Material topic: Greenhouse gas emissions). |
| 306 Waste 306-3 | The ESG strategy includes waste-related initiatives and targets. See ESG Strategy Initiatives and Targets page 8. Stabilized properties Solid waste is generated from the operation and maintenance of the rental portfolio, tenant and visitor activities, renovation and construction, and administration and office activities. The primary residential waste streams are household solid waste, recycling, and organics. Waste and diversion streams are source separated by residents (via chutes or bins depending on the property), managed by staff, and collected by municipal or private waste haulers. Information on waste management expectations is communicated to residents through welcome packages, posted information, and additional communications and reminders as needed including tips on Minto’s Live More with Minto Blog and in resident newsletters. A third-party service provider was contracted to review waste management across the portfolio including reviewing existing waste haulers and recommending changes where appropriate, collecting and reporting waste data for stabilized properties, and provision of support to reduce waste generation and increase waste diversion through resident education. The following results were available for 2023: - Total waste to landfill: 1248 metric tonnes. - Total waste diverted from landfill (mixed recycling, cardboard, beverage containers, mixed paper, and compost): 399 metric tonnes. - Combined total: 1647 metric tonnes. - Diversion rate: 24%. - Reported data covers 59% of the portfolio. The following results were available for 2024: - Total waste to landfill: 1477 metric tonnes. - Total waste diverted from landfill (mixed recycling, cardboard, beverage containers, mixed paper, and compost): 421 metric tonnes. - Combined total: 1898 metric tonnes. - Diversion rate: 22%. - Reported data covers 42% of the portfolio. Note: Although recycling programs are in place, the amount of waste diverted is not measured/available for all properties. As a result, the amount of waste diverted and the diversion rate reported are lower than actual. A breakdown of the composition of waste disposed of in landfill is not available. Waste diverted from landfill includes mixed recycling, cardboard, paper, and organics. Development projects The REIT is committed to diversion of construction waste from its development projects. Data is collected from waste haulers by project managers. 2023: - Total waste: 361 metric tonnes. - Total waste diverted: 319 metric tonnes. - Diversion rate: 88.3%. - Project: York Mills Leslie, Richgrove. 2024: - Total waste: 1527.6 metric tonnes. - Total waste diverted: 1320.6 metric tonnes. - Diversion rate: 86.4%. - Project: York Mills Leslie, Richgrove. Waste streams include gypsum, wood, concrete/cleanfill/asphalt, metals, and solid waste (landfill). See the 2024 Sustainability Report page 26 and 29 and Methodology page 3 for more information on waste and the waste data and the 2023 ESG Report pages 30 and 48 for more on the more previous year’s data. Environmental Policy: here. (Material topic: Waste reduction and diversion). |
401 Employment 401-1 | See the 2024 Sustainability Report pages 17 to 20 and 22 for disclosures on employees, employee engagement, and employee well-being. See Who Makes Up Our Team pages 1 to 2 for new employee hire and turnover data and additional employee data. See the 2023 ESG Report pages 13, 19 to 23, 26 and 27 for disclosures on employees, employee engagement, and employee well-being and Who Makes Up Our Team page 3 for 2023 new employee hire and turnover data. See Key Personnel risk: Management’s Discussion and Analysis page 47. Diversity Policy: here. (Material topic: Employee engagement and well-being). |
403 Occupational Health and Safety 403-8 | An occupational health and safety management system has been implemented to address industry standards and best practices and is aligned with, but not registered to, OHSAS 18001. The system has not been implemented because of a legal requirement; however, elements of the system address legal requirements. The system applies to all REIT employees (252 employees at the end of 2024), activities, and workplaces as well as contractors carrying out work on behalf of the REIT at REIT properties. The system includes regular workplace inspections and audits by health and safety consultants which identify occupational health and safety hazards and assess risks, health and safety training for all staff including training on their roles and responsibilities, on-going analysis and internal reporting of results, documented hazard reporting, accident investigation, and work refusal processes. Health and safety training for employees and contractors includes but is not limited to Health and safety orientation, training on policies and procedures, roles and responsibilities, leadership for supervisors, emergency preparedness and response, and hazard-specific training (e.g. working at heights, safe equipment operation). The health and safety management system is supported by Joint Health and Safety Committees and Health and Safety Representatives whose functions include health and safety meetings (monthly unless otherwise specified), inspections, recommendations, inspection follow-ups, corrective measures, and accident investigations. Roles and responsibilities including processes and responsibilities for accident reporting are documented and comply with applicable provincial requirements. In Canada, health services are provided by provincial governments. See the 2024 Sustainability Report page 21 regarding the health and safety program and performance metrics and page 20 and Live More with Minto regarding health promotion and programs. Fatalities: 0. Number of lost time injuries: 4. Number of lost days: 35. See 2023 ESG Report page 22 for 2023 data. Health and Safety Policy: here. (Material topic: Health and safety). |
405 Diversity and Equal Opportunity 405-1 | Indicators of diversity monitored and recorded in 2024: Board of Trustee members: 2024 Sustainability Report page 7. Gender - Female: 43%. - Male: 57%. Age Group - Under 30: 0%. - 30-50: 29%. - Over 50: 71%. Ethnically Diverse - 14%. Executives and other Employees: 2024 Sustainability Report page 17, Who Makes Up Our Team pages 1 to 2. For indicators and links to indicators of diversity monitored and recorded in previous years see 2023 ESG Report page 70. Workplace Harassment & Discrimination Policy: here. Diversity Policy: here. Advancing our commitment to acceptance and inclusion: 2023 ESG Report page 13 and Featured Story. Diversity of the Board of Trustees and senior management: Management Information Circular page 28 to 29. (Material topic: Diversity and inclusion). |
Other material topics | Climate change resilience: See Management’s Discussion and Analysis page 45-46, 2024 Sustainability Report page 30 to 32, the ESG Strategy Initiatives and Targets page 1; disclosures are also provided in the SASB Content Index later in this document in metrics IF-RE-450a.1 to 2. Resident well-being: See 2024 Sustainability Report page 23, ESG Strategy Initiatives and Targets on page 5 and Live more with Minto Reputation Award Winner and Building a Strong Sense of Community. Risk management: The REIT faces a variety of diverse risks, many of which are inherent in the business conducted by the REIT. The REIT maintains multiple processes for evaluating and managing risk. Examples include: - Broad processes such as maintenance of an enterprise risk assessment which is reviewed and updated annually and includes consideration of likelihood of the risk, impact, and controls. - Transactional processes such as our due diligence process for new acquisitions which includes evaluation of ESG-related risks. - Subject matter-specific processes such as cyber security risk assessments, inspections to identify health and safety hazards or building-specific risks and anomalies, and our climate change risk assessment initiative. The effectiveness of risk mitigation measures are evaluated in subsequent assessments. See Risks and Uncertainties: Management’s Discussion and Analysis page 42 to 49. No specific policy document. |
SASB content index
SASB code and topic | Metric/Explanation |
|---|---|
IF-RE-130a.1 Energy Management | 2024 energy consumption data coverage as a percentage of gross floor area: - Natural gas data: 93%. - Electricity data: 68%. - Complete energy data: 68%. |
IF-RE-130a.2 Energy Management | Total energy consumed in 2024: 580,967 Gigajoules. Percentage energy consumed from grid electricity in 2024: 26%. None of the energy consumed was from renewable energy directly produced or purchased by the portfolio; however, electricity from the grid includes energy from renewable sources. |
IF-RE-130a.3 Energy Management | 2023 to 2024 Like-for-like percentage change in energy consumption: -0.5%. |
IF-RE-130a.4 Energy Management | Percentage of portfolio (by floor area) that had an energy rating in 2024: 87%. The properties are not certified to Energy Star |
IF-RE-130a.5 Energy Management | Energy management is included in property investment analysis and operational strategy as follows. The REIT: - Identifies issues and opportunities during screening and due diligence for new acquisitions and in the planning of new developments, in-fills, and major renovations. - Communicates issues, risks, and opportunities to the investment committee and includes their impact to the property in the valuation. - Includes energy considerations in management of the assets including technical building assessments, operational requirements, capital improvements, optimization of building operations, and engagement with staff, tenants, and procurement partners. At the end of 2020, the REIT set a target to reduce portfolio energy use by 10% by 2025, from a 2019 baseline. Monitoring, energy ratings, and benchmarking are used to evaluate and validate building performance. The ESG strategy includes an initiative to deploy a renewable energy strategy for new developments and stabilized properties which includes assessing renewable energy opportunities. Green plans for new developments include energy efficiency strategies. The ESG strategy includes an initiative to set energy efficiency and emissions targets for new developments (adapted to region). |
IF-RE-140a.1 Water Management | Water use data coverage as a percentage of total floor area: 2024: 72%. 2024 water use data coverage in regions with high or extremely high baseline water stress as a percentage of floor area: 100%. |
IF-RE-140a.2 Water Management | Total water consumed in 2024: 724 thousand cubic meters. Percentage of consumption in area of high water stress (2024): 55%. For the current reporting year, the Atlas identified Calgary and Toronto as areas of high or extremely high water stress. |
IF-RE-140a.3 Water Management | 2023 to 2024 Like-for-like percentage change in water consumption: -1%. |
IF-RE-140a.4 Water Management | Water management risks include costs, negative environmental impacts, and negative perception of excess water use. Strategies and practices to mitigate risks include: - Performing technical building assessments and monitoring. consumption to identify anomalies, opportunities for improvements, and the impact of implemented measures. - Implementation of capital projects to increase water efficiency. - Staff training to increase awareness and optimize operational efficiency. - Resident engagement to encourage reduction in usage. At the end of 2020, the REIT set a target to reduce portfolio water use by 5% by 2025, from a 2019 baseline. Auditing, monitoring and benchmarking are used to evaluate and validate building performance. Additional lifecycle impacts or trade-offs have not been identified due to the portfolio’s water management practices. |
IF-RE-410a.1 Management of Tenant Sustainability Impacts | Leases do not contain a cost recovery clause for capital improvements. |
IF-RE-410a.2 Management of Tenant Sustainability Impacts | As at December 31, 2024, approximately 88% of tenants were separately metered or submetered for electricity consumption where the submeter had been activated and the tenant pays for consumption. Electricity is from the electricity grid. As at December 31, 2024, 14% of tenants were separately metered or submetered for water consumption. Water is from the municipal drinking water system. |
IF-RE-410a.3 Management of Tenant Sustainability Impacts | Approach to measuring, incentivizing, and improving sustainability impacts of tenants: - Ongoing building utility consumption monitoring including electricity, natural gas, and water. - Submetering which provides a financial incentive for residents to reduce utility consumption (responsibility for utility costs is addressed in lease). - Capital projects which support reducing environmental impacts of resident activities. - Engagement with residents to support reducing environmental impacts including sharing performance results, commitments, and targets. - Engagement includes electronic distribution of quarterly, region-specific resident newsletters (can be provided to resident in hard copy upon request); newsletters include ESG content (e.g. season-specific conservation tips, encourage use of local businesses). - Resident satisfaction surveys carried out throughout the year (include on-going event-triggered: arrival, departure, service) which give residents an opportunity to provide feedback on their experience. |
IF-RE-450a.1 Climate Change Adaptation | Leasable area located in 100-year flood zones: 616,054 square feet. |
IF-RE-000.B Activity Metric | Residential Property Portfolio. Leasable floor area as of December 31, 2024: 6,195,979 square feet. |
IF-RE-000.C Activity Metric | All assets directly managed. |
IF-RE-000.D Activity Metric | 2024 Average occupancy rate: 96.8%. |
WHO MAKES UP OUR TEAM
A strong governance foundation
Total number of employees by contract
| Male | Female | Total | Alberta | Ontario | Quebec | Total | |
|---|---|---|---|---|---|---|---|
| Permanent | 149 | 102 | 251 | 10 | 192 | 49 | 251 |
| Temporary | 0 | 1 | 1 | 0 | 1 | 0 | 1 |
| Total | 149 | 103 | 252 | 10 | 193 | 49 | 252 |
| Male | Female | Total | Alberta | Ontario | Quebec | Total | |
|---|---|---|---|---|---|---|---|
| Non-guaranteed hours | 8 | 4 | 12 | 0 | 11 | 1 | 12 |
| Total | 8 | 4 | 12 | 0 | 11 | 1 | 12 |
Total number of employees by employment type
| Male | Female | Total | Alberta | Ontario | Quebec | Total | |
|---|---|---|---|---|---|---|---|
| Full-time | 131 | 85 | 216 | 10 | 158 | 48 | 216 |
| Part-time | 18 | 18 | 36 | 0 | 35 | 1 | 36 |
| Total | 149 | 103 | 252 | 10 | 193 | 49 | 252 |
13% Of employees are covered by collective bargaining agreements.
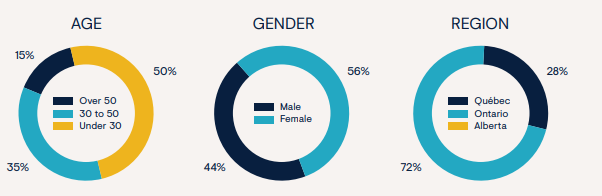
We made 72 hires in 2024.
Largely related to backfilling for departures, but also new roles tied to growth plans: (29% of the number of employees at the end of the reporting period)
- 36 - under 30 years old (50%)
- 25 - 30-50 years old (35%)
- 11 – over 50 years old (15%)
BY GENDER
- 40 female (56%)
- 32 male (44%)
BY REGION
- 0 in Alberta (0%)
- 52 in Ontario (72%)
- 20 in Quebec (28%)
BY AGE GROUP
- 26 - under 30 years old (37%)
- 32 - 30-50 years old (45%)
- 13 - over 50 years old (18%)
BY GENDER
- 39 female (55%)
- 32 male (45%)
BY REGION
- 2 in Alberta (3%)
- 56 in Ontario (79%)
- 13 in Quebec (18%)
The REIT supports the United Nation’s goals for peace and prosperity for people and the planet, now and into the future. REIT activities aligned with SDGs are indicated in the table below.
Gender equality
- Diversity, equity, and inclusion program implementation and data collection initiatives
- Diversity policy
Clean water and sanitation
- Water use reduction target
- Water consumption tracking, implementation of efficiency measures, staff and resident engagement
Affordable and clean energy
- Energy use reduction and efficiency targets
- Renewable energy strategy initiative
- Energy consumption tracking, implementation of efficiency measures, staff and resident engagement
Decent work and economic growth
- Innovation program initiative
- Technology strategy initiative
- Implementation of capital improvements and leveraging of internal and external expertise
- Employment standards, labour rights, pay equity
- Diversity, equity, and inclusion program
- Health, safety and well-being programs
Industry, innovation and infrastructure
- Retrofitting and optimizing existing properties, building new developments to be more sustainable
- Innovation strategy
Sustainable cities and communities
- Resident well-being initiative
- Improvements to existing buildings and development of new rental buildings, including improving energy and water efficiency
- Climate change risk assessment initiative
- Renewable energy strategy initiative
- Waste reduction and diversion initiative
- Emergency management, continuity of operations initiative
- Electric vehicle charging infrastructure planning
- Accessibility features in buildings
- Maintenance of outdoor spaces
Responsible consumption and production
- Water and energy tracking and efficiency measures, targets, and associated initiatives
- Waste reduction and diversion initiative
- Renewable energy strategy initiative
- ESG in procurement initiative
- ESG competency and resident engagement initiatives
Climate action
- Energy and water efficiency measures and targets
- Climate change risk assessment initiative
- Embodied carbon initiative
- Deep retrofit studies
- Renewable energy strategy initiative
- Emergency management, continuity of operations initiative
- ESG competency and resident engagement initiatives